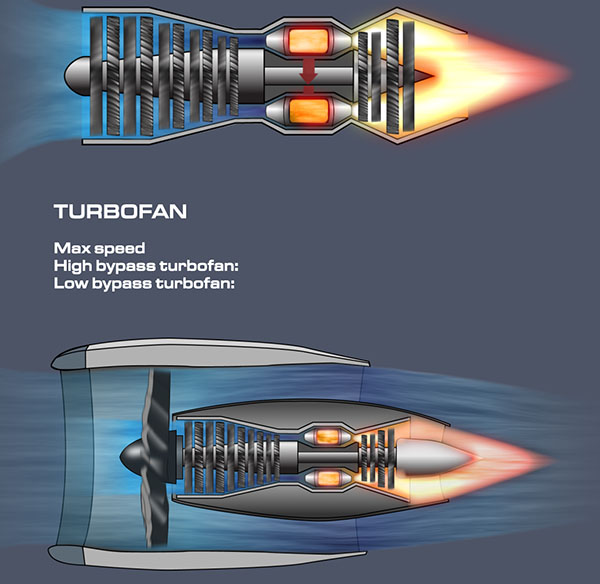
Turbojet vs. Turbofan Engines – Animated Schematic
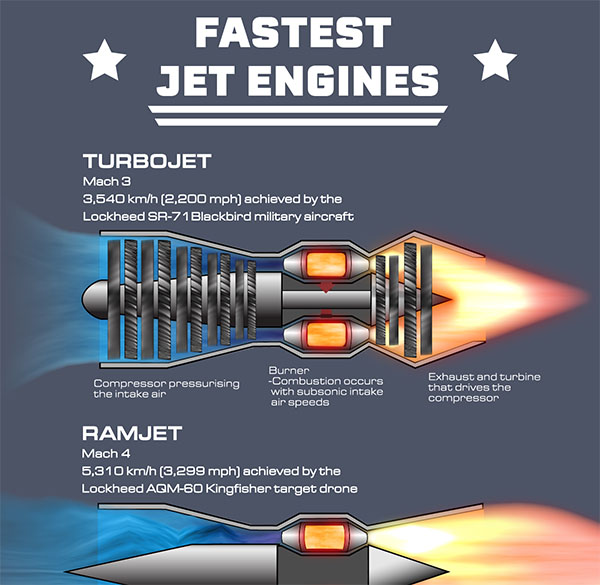
The Jet engine – a cornerstone of global travel The jet engine is one of the engineering wonders of the modern world. Without it, global travel and logistics would not be the same. To meet changing demands, jet engine design has evolved over the decades. Two types centre to this progress are the turbojet and […]
Turbojet vs. Turbofan Engines – Animated Schematic Read More »